Research
The report reflects the scope and character of U.S. foundation funding for LGBTQ communities and issues based on grants that were awarded in calendar year 2024.
Drawing on an analysis of 1,819 grants totaling $447.3 million, the report examines how philanthropic funding practices shape the sustainability of women of color leadership in the nonprofit sector.
This report offers vital insight into how nonprofits are faring amidst unprecedented challenges and how leaders are responding.
This report by ABFE & Candid analyzes the degree to which private foundations have supported—or failed to support—Black-led nonprofits over time and examines funder–grantee relationships across three dimensions: financial, social, and human-centered support.

The report reflects research on national trends in public media and local journalism, as well as conversations with stakeholders across New Jersey.
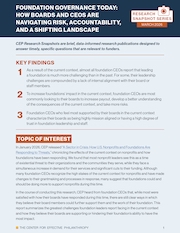
This brief CEP Research Snapshot builds on CEP's recent "Sector in Crisis" report, and examines how foundation leaders are navigating the challenges created by the current U.S. federal policy context — including legislative actions, executive orders, and budget decisions — and how their boards are supporting or hindering their ability to have impact.
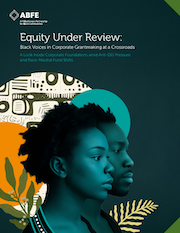
This ABFE report reflects on the evolving corporate philanthropy's commitment to Black communities.
This Grantmakers for Effective Organizations's latest report outlines the potential of more effective governance, highlighting promising practices that grantmakers are testing and learning from as they explore governance purpose, roles, relationships and processes.
This report draws on survey data, interviews with infrastructure leaders and funders, and a targeted review of relevant literature to analyze and explore how infrastructure shapes the sustainability, reach, and equity of collective giving.
This report aims to help fundraisers, grantmakers, donors, consultants, and more anticipate and prepare for what's next in our field.